Part of the AI Iceberg series — a contrarian counterpoint to "Above the Iceberg."
The Climate Risk Hiding in Plain Sight
Seventy-nine percent of global data center capacity now faces elevated acute climate hazards — flooding, wildfire, extreme heat, drought. That finding comes from First Street's June 2026 analysis of 97 global data center markets, and it deserves more than a footnote in infrastructure planning conversations.
In the Asia-Pacific region, 89% of capacity sits in markets with elevated chronic climate stress. In the Americas, 50%. Northern Virginia, the single largest concentration of data center infrastructure on the planet, ranks among the highest-exposure markets globally. These facilities are built to operate for 20 to 30 years. The risk compounds across every one of those years.
Matthew Eby, Founder and CEO of First Street, put it plainly: "Most underwriting for real assets still uses historical data, but the climate is no longer behaving the way the historical record would predict."
The industry's response to this finding has been to build more. More data centers. More racks. More megawatts. $600 billion in hyperscaler capex is projected for 2026 alone — a 36% increase over 2025. Amazon, Google, Meta, and Microsoft are each individually exceeding $100 billion.
Before we talk about where to build the next one, it is worth asking: how well are we using what we already built?
Section 1 — The 5% Number
The anchor statistic for this conversation comes from Cast AI's 2026 State of Kubernetes Optimization Report, which analyzed tens of thousands of real production clusters running on AWS, Azure, and GCP — before any optimization was applied. The finding: average GPU utilization across enterprise production = 5%.
Not 5% at off-peak hours. Not 5% for a single workload type. Five percent on average, across the fleet, in production.
GPUs sit idle for roughly 19 out of every 20 hours of billable time. CPU utilization in the same clusters averaged 8% (down from 10% the prior year). Memory averaged 20% (down from 23%). The direction of travel is not toward efficiency — it is away from it.
VentureBeat's Q1 2026 AI Infrastructure and Compute Market Tracker pegs total AI infrastructure spend at approximately $401 billion annually. At 5% utilization, roughly $381 billion of that annual spend is producing no computational output. For every dollar the enterprise AI sector spends on GPU infrastructure, 95 cents is doing nothing.
To understand how far outside normal operating range this is: a reasonable human-managed deployment, with no deliberate optimization beyond natural day/night and weekend scheduling, would produce approximately 30% GPU utilization. The industry's current average is six times worse than what you would get by accident. Industry benchmarks suggest 65–75% average GPU utilization for genuinely efficient operations. NVIDIA's Multi-Instance GPU (MIG) partitioning routinely pushes utilization to 40–70% in production inference pipelines. Training runs peak at 90–95% with careful orchestration.
The gap between 5% actual and 40–70% achievable is not a hardware gap. It is not a chip shortage or a rack shortage or a power shortage. It is an orchestration and software design gap.
Section 2 — The VSM Lens: Where the Waste Actually Lives
Value Stream Mapping is an operations engineering discipline — it traces every step a product takes from raw material to delivered value, asking one question at each stage: is this step adding value, or is it waste? Waste is anything the customer would not pay for if they knew it existed.
Applied to an inference pipeline, the technique is revealing.
Stage 1: Cold Start and Provisioning
A typical inference job on a dynamically provisioned instance: instance boot takes roughly 45 seconds at 0% GPU utilization; model download from object storage takes 60 seconds at 0%; model load into VRAM takes 25 seconds at ~10%; actual inference runs for 40 seconds at ~85%; teardown takes 15 seconds at 0%.
Total: approximately 3 minutes of billable GPU time. Useful work: roughly 40 seconds. That is 78% waste before the model does anything — before a single token is generated. Pure idle-time waste in VSM terms. The fix is warm instance pools and model preloading — neither requires new hardware.
Stage 2: Request Batching
Static batching — processing one request at a time — leaves the GPU 60–80% idle between requests. A single LLM request uses only 5–15% of available GPU capacity. The remaining 85–95% sits unused while the system waits for the next request.
Continuous batching, as implemented in vLLM and similar inference engines, changes this fundamentally. GPU utilization climbs from roughly 40% to 85–95% under load. Throughput improvement: approximately 2x. Cost per query reduction: roughly 37%. Same hardware, same model, same queries — different scheduling approach. Pure software intervention. No new GPUs required.
Stage 3: KV Cache Management
Standard KV cache pre-allocation wastes 60–80% of VRAM, limiting concurrent requests. PagedAttention — the memory management innovation at the core of vLLM — manages KV cache the way operating systems manage virtual memory: in dynamic pages rather than pre-allocated contiguous blocks. More concurrent requests fit on the same GPU.
Prefix caching, which stores computed attention states for repeated system prompts, delivers 30–50% cost reduction on workloads with common system prompt patterns — a characteristic of virtually every enterprise AI deployment using shared instruction templates.
Stage 4: Memory Bandwidth — The Real Bottleneck
During the decode phase of LLM inference — token generation — the primary constraint is not GPU compute. It is DRAM bandwidth. A December 2024 systematic characterization published on arXiv found that 70–80% of cycles are stalled during decoding due to memory bandwidth saturation. The GPU cores are waiting for data, not processing it.
SpecOffload research (arXiv, 2025) quantified this directly: average GPU core utilization during the decode phase reaches only 13% at most in existing inference methods. Thirteen percent — during the phase that defines the latency users experience.
This is the Von Neumann bottleneck — the memory wall — playing out in real production systems at scale. Quantization (INT8/FP8), State Space Models for long-context workloads, and speculative decoding all target this constraint. None require more GPUs. They require better software design around the ones that already exist.
Stage 5: Model-to-Workload Mismatch
The default enterprise pattern assigns a full GPU to every deployed model regardless of actual compute requirements. An embedding model that needs a fraction of one GPU runs on a dedicated $35,000 H100. A classification task that could be handled by a 7B model runs through a 70B dense model because someone configured it once and never revisited the routing logic.
MIG partitioning allows a single A100 or H100 to run multiple workloads in isolated compute slices. Mixture-of-Experts architectures like DeepSeek V3 and Llama 4 activate only a fraction of parameters per token, delivering 5x fewer FLOPs per request than equivalent dense models. Many deployments still route all traffic through dense models because the architecture decision predates MoE maturity.
The VSM Summary
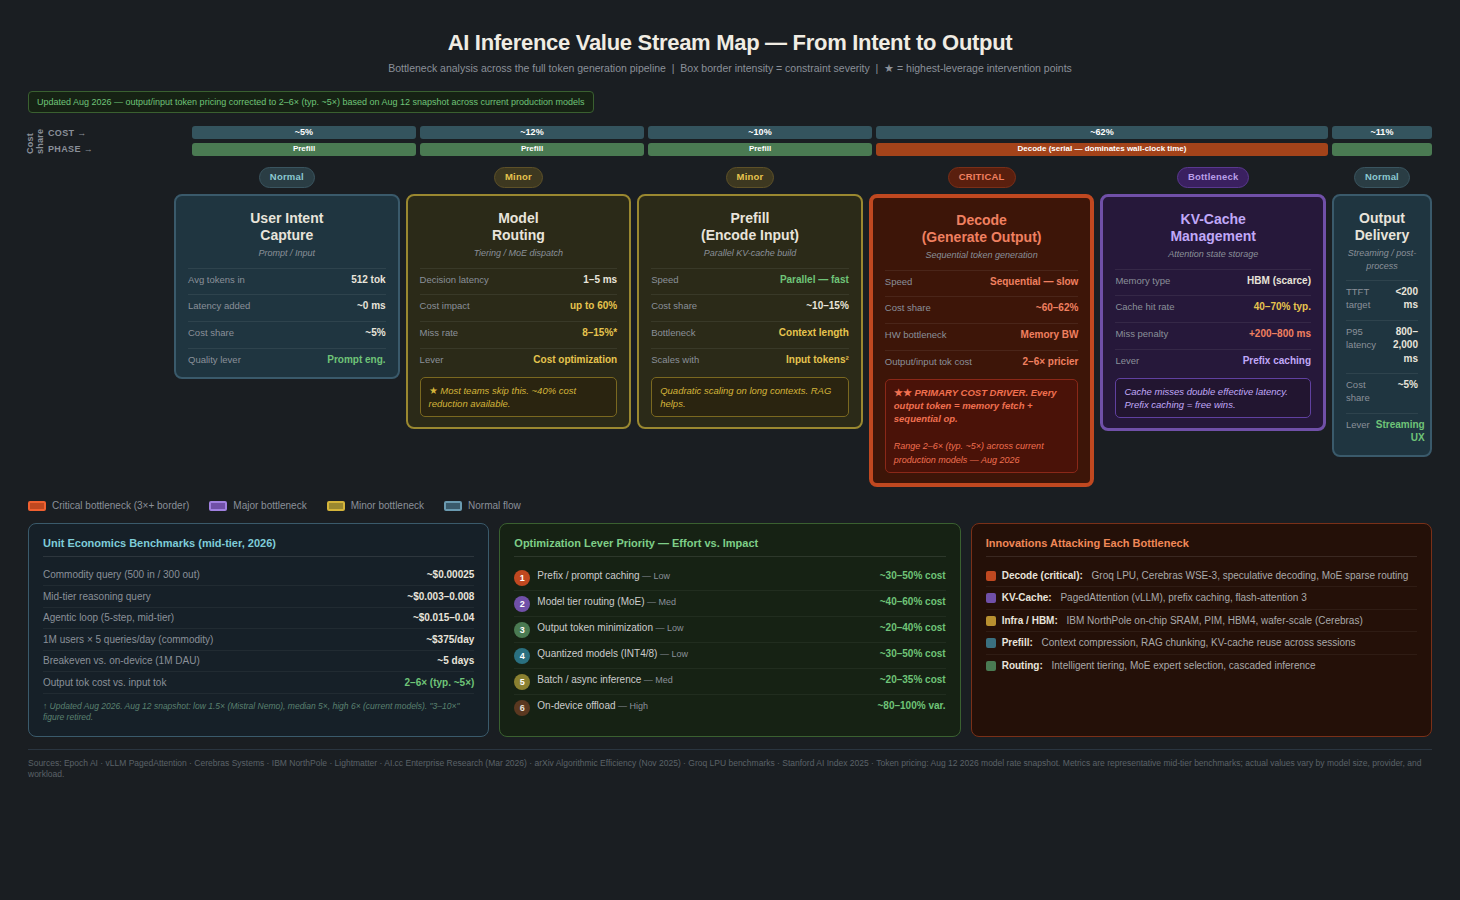
| Stage | Time Share | GPU Util | Waste Type | Fix |
|---|---|---|---|---|
| Cold start / provisioning | ~35% | 0% | Idle time | Warm pools, model preloading |
| Request queuing / batching | ~25% | 20–40% | Underutilization | Continuous batching (vLLM) |
| Prefill (prompt processing) | ~10% | 60–80% | Compute-bound | Flash Attention, tensor parallelism |
| Decode (token generation) | ~20% | 13–24% | Memory-bandwidth bound | PagedAttention, quantization, SSMs |
| Teardown / scaling | ~10% | 0% | Idle time | Shared pools, MIG partitioning |
The value stream of inference is dominated by stages where the GPU is either completely idle or fundamentally limited by memory architecture rather than raw compute capacity. More GPUs do not fix idle time. More GPUs do not fix memory bandwidth saturation. More GPUs do not fix a routing decision that sends every query through a 70B dense model.
Section 3 — The Supply-Side Fixation
Hyperscaler capex for 2026 is projected at over $600 billion — a 36% increase from 2025 — with roughly 75% of that spend ($450 billion) targeting AI infrastructure directly. Deloitte projects data center power demand of 92 GW by 2027, up 50% from current levels. McKinsey's models put AI data center demand at 156 GW by 2030, requiring $5.2 trillion in cumulative capex.
These numbers look very different when you start from utilization reality rather than capacity projections.
Introl's infrastructure efficiency benchmarks suggest software optimization alone yields 20–30% annual efficiency gains in GPU fleet operations. Every 10-point improvement in GPU utilization across the installed base eliminates roughly $40 billion in infrastructure spend required to deliver equivalent AI compute output. If the industry moves from 5% average utilization to 50% — a 10x improvement entirely within the range of documented techniques — the data center capacity required to serve current AI demand drops by a corresponding factor. The $5.2 trillion McKinsey projection is premised, implicitly, on utilization assumptions that are off by an order of magnitude.
There is also the climate feedback loop. The 79% exposure figure describes the existing installed base. Building more capacity in Northern Virginia, Johor, and Marseille — which First Street already identifies as highest-risk — compounds the exposure. Building more efficiently in existing locations reduces the physical footprint required to deliver the same workload. The climate risk calculation and the utilization calculation point in the same direction.
The industry has constructed an implicit hierarchy in which GPU utilization is treated as an engineering footnote while data center construction is treated as a strategic priority. The value stream says the opposite. The bottleneck is not on the supply side. It is on the activation side.
Section 4 — What Builders Can Do Now
The VSM analysis maps to an optimization stack in three tiers, differentiated by implementation time.
Tier 1 — Zero-cost interventions (hours to implement):
Enable continuous batching in your inference engine. In vLLM, it is on by default — the configuration change that gets its full benefit is tuning --max-num-seqs and --max-num-batched-tokens to match your concurrency profile. The before/after is well-documented: 40% GPU utilization to 85%, roughly 2x throughput, roughly 37% cost reduction per query. Run kubectl top nodes alongside nvidia-smi across your fleet and calculate the 7-day gap between provisioned and consumed GPU-seconds. That gap is your utilization baseline. Most teams do not have this number.
Tier 2 — Low-cost interventions (days to implement):
MIG partitioning on any A100 or H100 running inference workloads. NVIDIA's documentation covers the configuration in under an hour; production deployments routinely reach 40–70% utilization post-implementation. Prefix caching on repeated system prompt payloads delivers 30–50% cost reduction. Quantization to INT8 or FP8 for workloads currently running FP16 delivers 4–8x memory reduction with equivalent output quality for most inference tasks — and directly addresses the memory bandwidth bottleneck from Stage 4.
Tier 3 — Architecture decisions (weeks to implement):
Tiered model routing — right-sizing model to query complexity — typically delivers 40–60% cost reduction on mixed workloads. MoE model selection for applicable workloads delivers up to 5x fewer FLOPs per inference. Semantic caching — caching semantically similar queries, not just exact matches — has shown 71% cache hit rates in production. State Space Models for long-context workloads break the quadratic attention scaling that makes dense Transformer architectures progressively more expensive as context windows grow.
None of these interventions require a capital expenditure decision. None require a procurement cycle. All are documented, deployed, and producing measurable results in production today.
Section 5 — The Builder's Implication
Two competing claims about where AI cost reduction comes from:
The first: build more, build better, build bigger. The orbital compute article in this series represents the frontier of that argument — the proposition that the next phase of AI capability may require escaping terrestrial constraints entirely.
The second: extract more from what exists. This article represents that argument.
The honest answer is that both are true over different time horizons. Hardware improvements compound across years; software optimizations are available now, this quarter, with infrastructure already paid for.
The uncomfortable finding: at 5% average GPU utilization, the AI industry is not experiencing a hardware shortage. It is experiencing an orchestration shortage. The hardware exists. The compute capacity exists. It is sitting idle 95% of the time — provisioned but not activated, paid for but not used, deployed but not optimized.
Every data center built before the orchestration problem is addressed is a data center built on top of a waste stream. The climate exposure compounds. The sunk cost compounds. The gap between what was spent and what was used compounds.
The data centers being built now to handle the next decade of AI demand are being designed around utilization assumptions that are off by a factor of 10. If the gap closes — and the combination of economic pressure, competitive dynamics, and available tooling suggests it will — the infrastructure buildout required is a fraction of what the current capex wave implies.
The question worth asking is not "where do we build the next gigawatt?" It is: "how do we get to 50% utilization on the gigawatt we already have?"
Sources:
- First Street, "Climate Risk in Global Data Center Markets: Implications for Investment and Performance" (June 2026): https://www.prnewswire.com/news-releases/79-of-global-data-center-capacity-faces-elevated-climate-risk-302804645.html
- Cast AI, "2026 State of Kubernetes Optimization Report" (April 2026): https://cast.ai/blog/2026-state-of-kubernetes-resource-optimization-cpu-at-8-memory-at-20-and-getting-worse/
- TechFastForward, "Enterprises Are Burning $401 Billion on AI Hardware Running at 5% GPU Utilization" (May 2026): https://techfastforward.com/articles/enterprise-gpu-utilization-5-percent-401-billion-waste-2026
- Introl, "Hyperscaler CapEx Hits $600B in 2026" (January 2026): https://introl.com/blog/hyperscaler-capex-600b-2026-ai-infrastructure-debt-january-2026
- Spheron, "LLM Serving Optimization: Continuous Batching, PagedAttention" (2026): https://www.spheron.network/blog/llm-serving-optimization-continuous-batching-paged-attention/
- arXiv / SpecOffload, "Unlocking Latent GPU Capacity for LLM Inference" (2025): https://arxiv.org/html/2505.10259v2
- Globest / First Street + Goldman Sachs, "Climate Risk Is Repricing Global Data Center Markets" (June 2026): https://www.globest.com/amp/2026/06/23/climate-risk-is-repricing-global-data-center-markets/
- Reinsurance News, "79% of global data centre capacity exposed to elevated climate risk: First Street" (June 2026): https://www.reinsurancene.ws/79-of-global-data-centre-capacity-exposed-to-elevated-climate-risk-first-street/